Using AI to detect Anomalies
within Work orders

A tool to empower facility manager to unlock AI-Driven Insights for Facility Management

0-1

Web Design

Growth Design

AI/ML

Role: Lead Growth Designer

Duration: 12 Months

Company: Service Channel

Overview

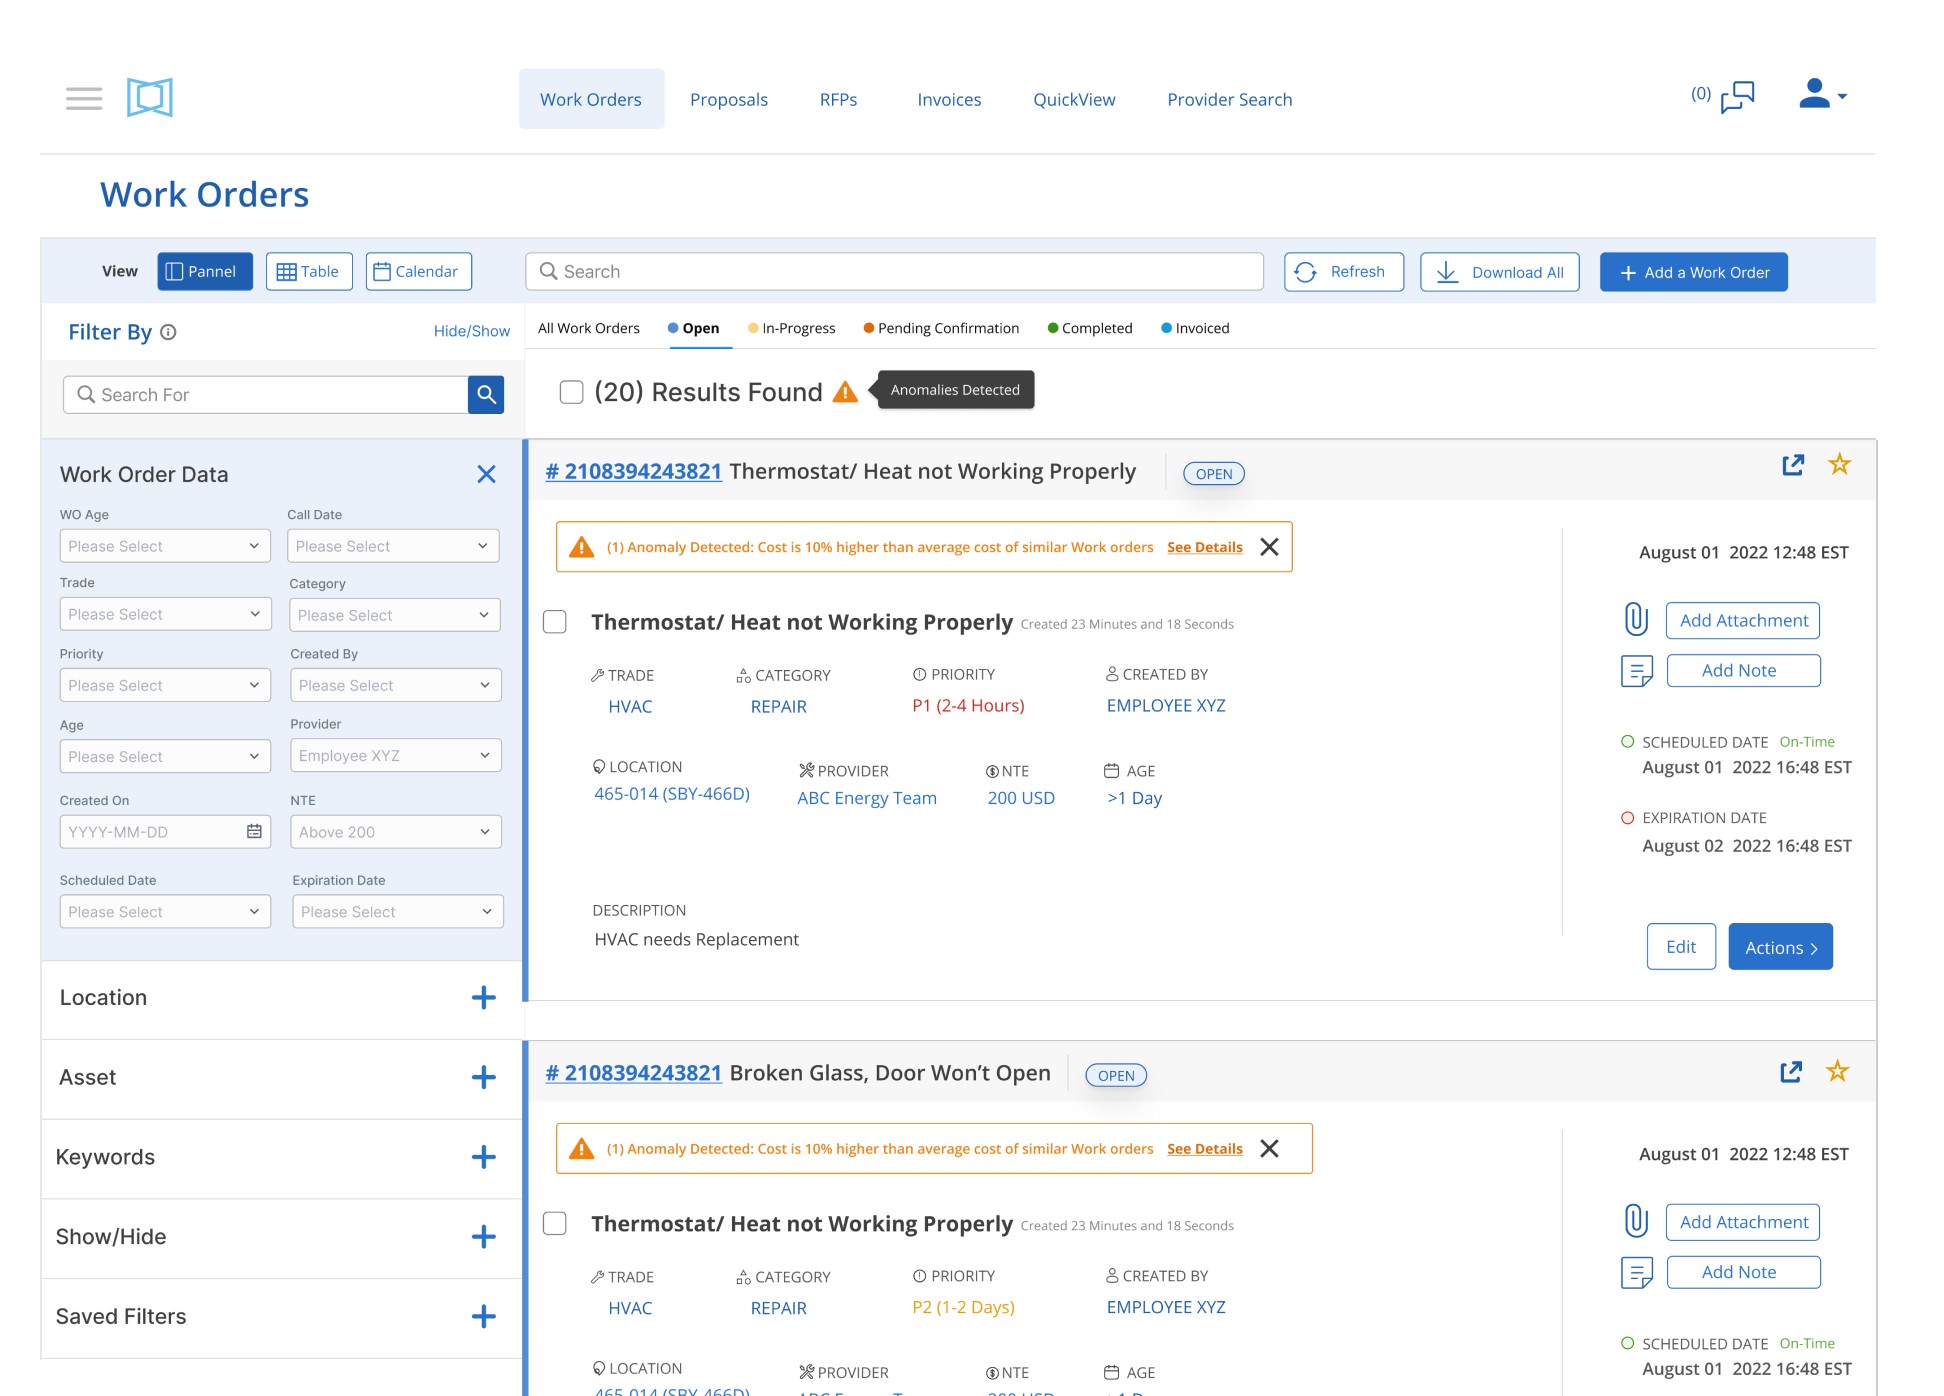
The Work Order Anomaly Detection project aimed to streamline how facility managers identify and address anomalies in work orders. Leveraging AI to automate the process, I focused on simplifying workflows and reducing manual effort. Through user research across industries and close collaboration with engineers and data scientists, we designed an intuitive alert system with clear visualizations and filtering options. This solution aimed to improve anomaly detection, increased productivity, and better supported users in achieving their goals.

Problem

ServiceChannel faced challenges in adapting to the growing demands of the facility management sector, particularly in providing real-time, data-driven insights to its users. The lack of clarity around user personas, workflows, and jobs to be done resulted in a product portfolio that wasn’t fully optimized for revenue growth. Additionally, there was a pressing need to identify untapped market opportunities that could provide both customer value and monetization potential.

Solution

Through experimentation and research, I developed the AI-powered "Work Order Anomaly Detection" feature to alert facility managers to potential issues in work orders. Using a blend of UX Processes and product strategy to approach the problem space, I ensured my approach was a data-driven solution that met the needs of both our user groups, aligning with user workflows and market demands.

Results

Through early experimentation and close collaboration with data scientists, I identified a critical data ingestion issue, and a lack of standardization that would have hindered the success of the AI-driven anomaly detection system. By addressing the problem early, we proved that the solution, as initially conceived, would not be feasible due to poor data quality. This early pivot because of this finding saved the company $480,729 in potential development costs.

My Team

Hustler

Product Manager

Hacker

Data Scientist

Designer

Product Designer

“Pod” Team-Like Structure

Fun Fact, my team was formed via a series of DisC Assessment to determine our compatibility as a pod to deliver results.

“Pod” Team-Like Structure

Fun Fact, my team was formed via a series of DisC Assessment to determine our compatibility as a pod to deliver results.

How was the Problem Space identified?

Growth Accelerator Charter

This charter was written by the executive board as a hypothesis on where there is an opportunity for value based on the data gathered in the LPM stage.

This charter was written by the executive board as a hypothesis on where there is an opportunity for value based on the data gathered in the LPM stage.

Innovation Process

The Innovation Process

The innovation process that my team & I followed, it’s a hybrid of lean UX and the double diamond with a mix of product strategy

The innovation process that my team & I followed, it’s a hybrid of lean UX and the double diamond with a mix of product strategy

01

Market Discovery

01

Market Discovery

MEKKO Chart Used in Market Discovery & Segmentation

During market discovery, our Data Scientist’s MEKKO chart revealed that our facility management solution should focus on Hyper-enterprise and Enterprise segments due to their higher R&M spending, cost-saving potential, and demand for data-driven insights. Leveraging this data, I took the lead in designing a targeted user research plan tailored specifically to these segments.

02

VOC User Research

02

VOC User Research

Narrowing in the problem space

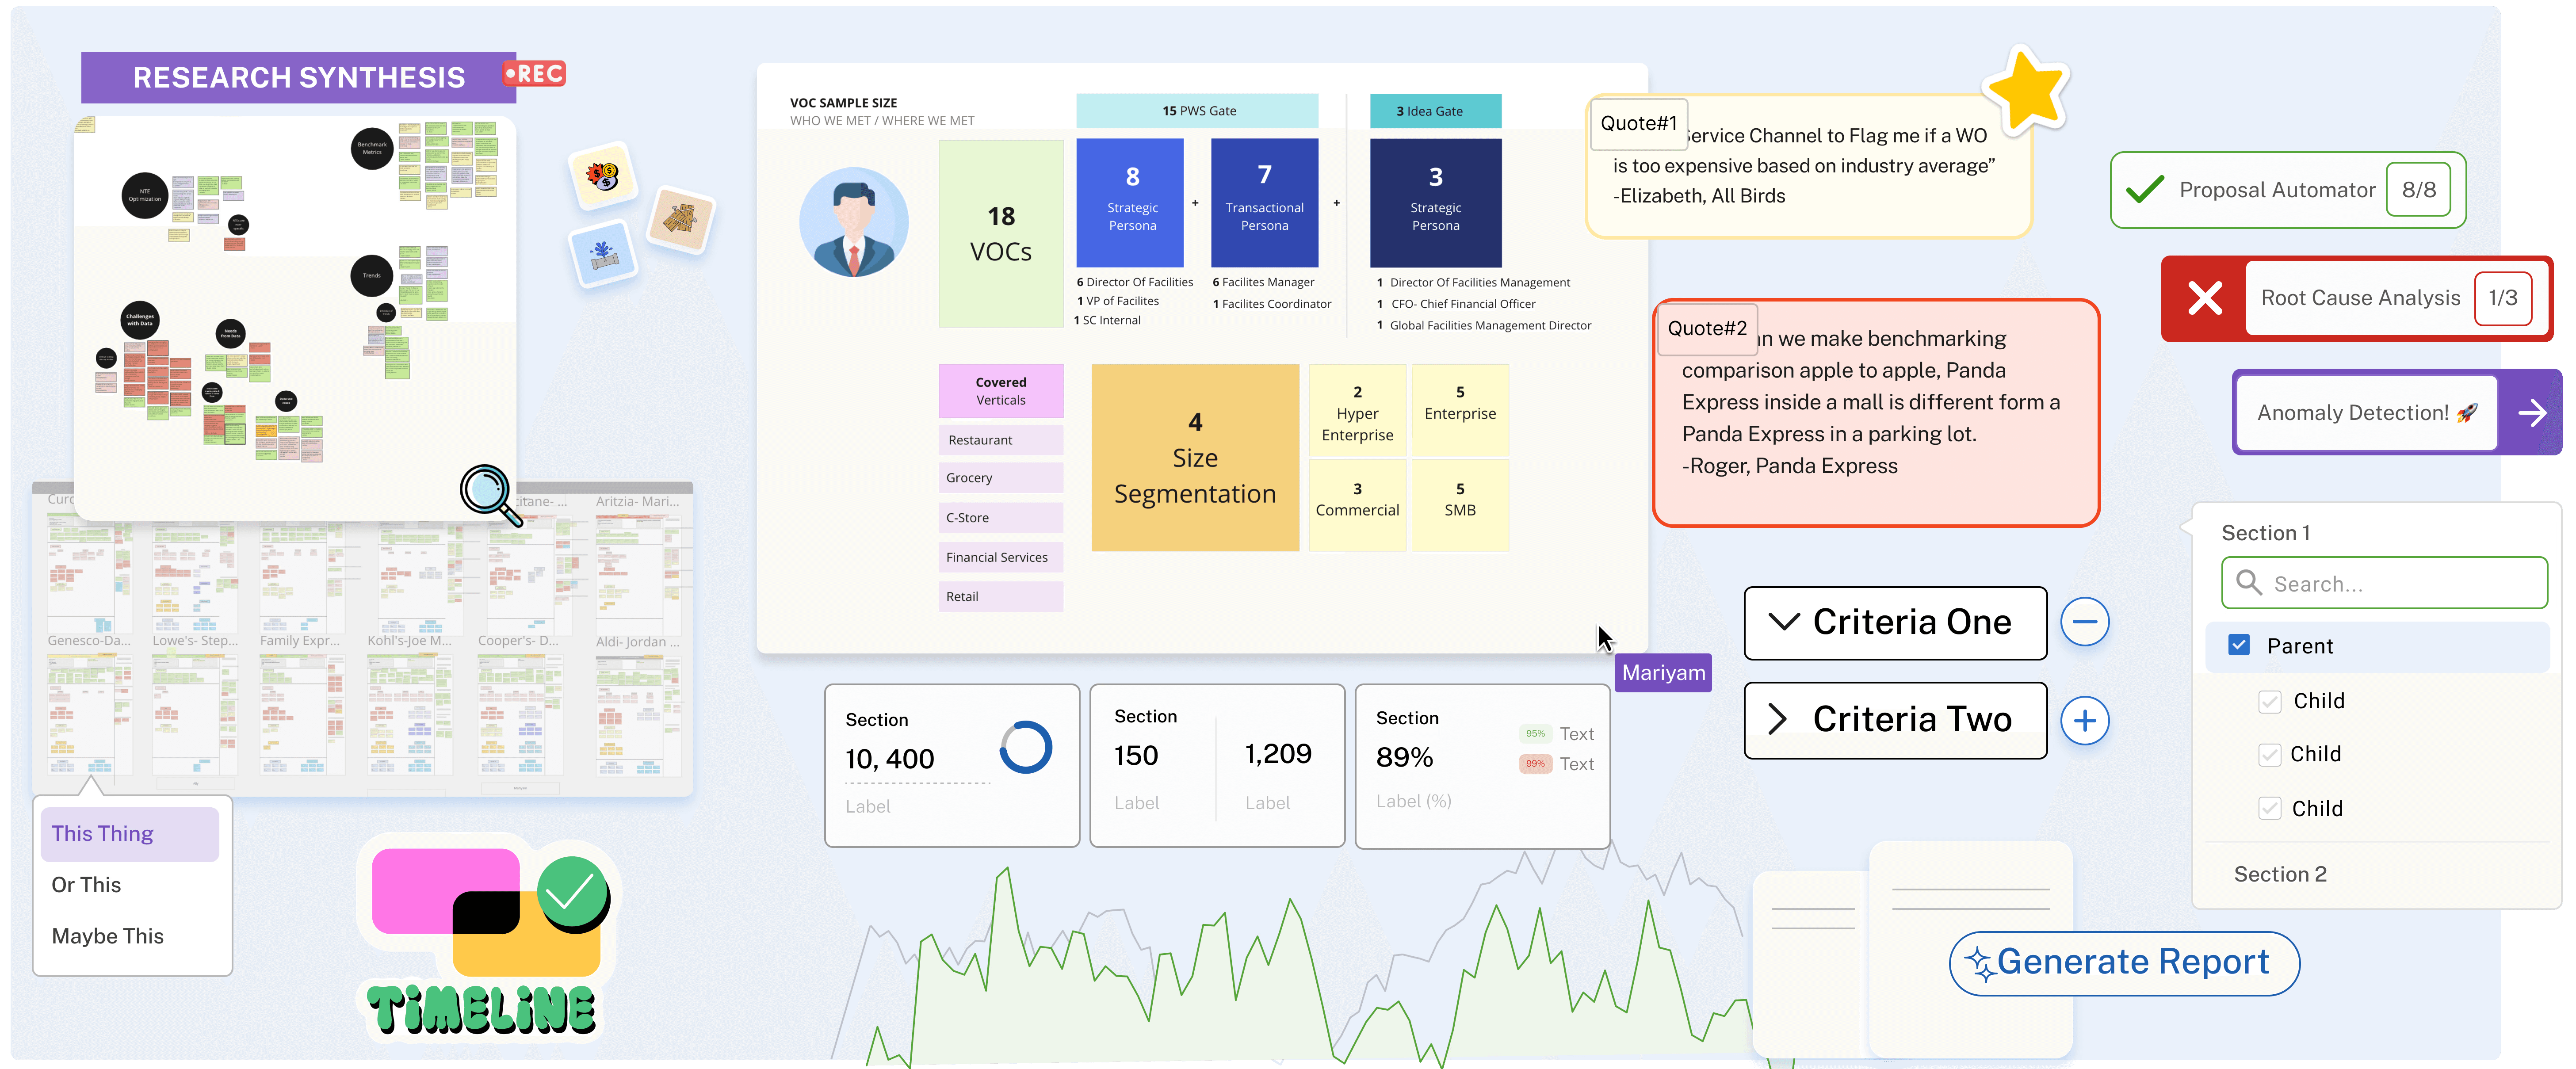
Research findings, narrowing into the problem space through research

VOC/Research Mood Board

I led over 15 Voice of Customer (VOC) sessions to uncover key challenges faced by our target customer segments. Through this research, I identified two distinct user personas: transactional and strategic Facility Managers, both with a strong focus on benchmarking and data-driven insights. These findings were key in guiding me in creating user-centered experimentation.

I led over 15 Voice of Customer (VOC) sessions to uncover key challenges faced by our target customer segments. Through this research, I identified two distinct user personas: transactional and strategic Facility Managers, both with a strong focus on benchmarking and data-driven insights. These findings were key in guiding me in creating user-centered experimentation.

Customer Journey Map

Two types of Personas were discovered
Customer Journey Map of Facility Manager of both user personas: Transactional and Strategic

Customer Journey Map

Customer Journey Map of Facility Manager of both user personas: Transactional and Strategic

Customer Journey Map of Facility Manager of both user personas: Transactional and Strategic

03

Ideation of Solution

03

Ideation of Solution

03

Ideation of Solution

Assumptions Mapping is a team exercise where desirability, viability, and feasibility hypotheses are made explicit and prioritized in terms of importance and evidence

Assumption Mapping

I led an 'Assumption Mapping' workshop to identify and prioritize risky hypotheses to focus on experiments that matter. This process highlighted key solutions prioritizing:

  1. Proposal Recommender

  2. Spend Benchmarking

  3. Work Order Anomaly Detection

  4. Provider Network Evaluation


04

Rapid Experimentation

04

Rapid Experimentation

04

Rapid Experimentation

We refined our assumptions and evaluated their impact using 'Fit' and 'Wow' scores, rated on a 1-10 scale. The 'Fit' score measured how well a solution aligned with the user's organization, while the 'Wow' score gauged the excitement and appeal of the solution. Alongside qualitative data, these scores helped us determine which ideas were worth pursuing.

We refined our assumptions and evaluated their impact using 'Fit' and 'Wow' scores, rated on a 1-10 scale. The 'Fit' score measured how well a solution aligned with the user's organization, while the 'Wow' score gauged the excitement and appeal of the solution. Alongside qualitative data, these scores helped us determine which ideas were worth pursuing.

These metrics were used to assess the success of the experiments once they were tested with customers, helping us determine which experiments to pursue and which to archive for future consideration

Exploring Three Experiments to Uncover
Effective Upsell Strategies

  • Work Order Anomaly | Fit Score of 10 and Wow Score of 10

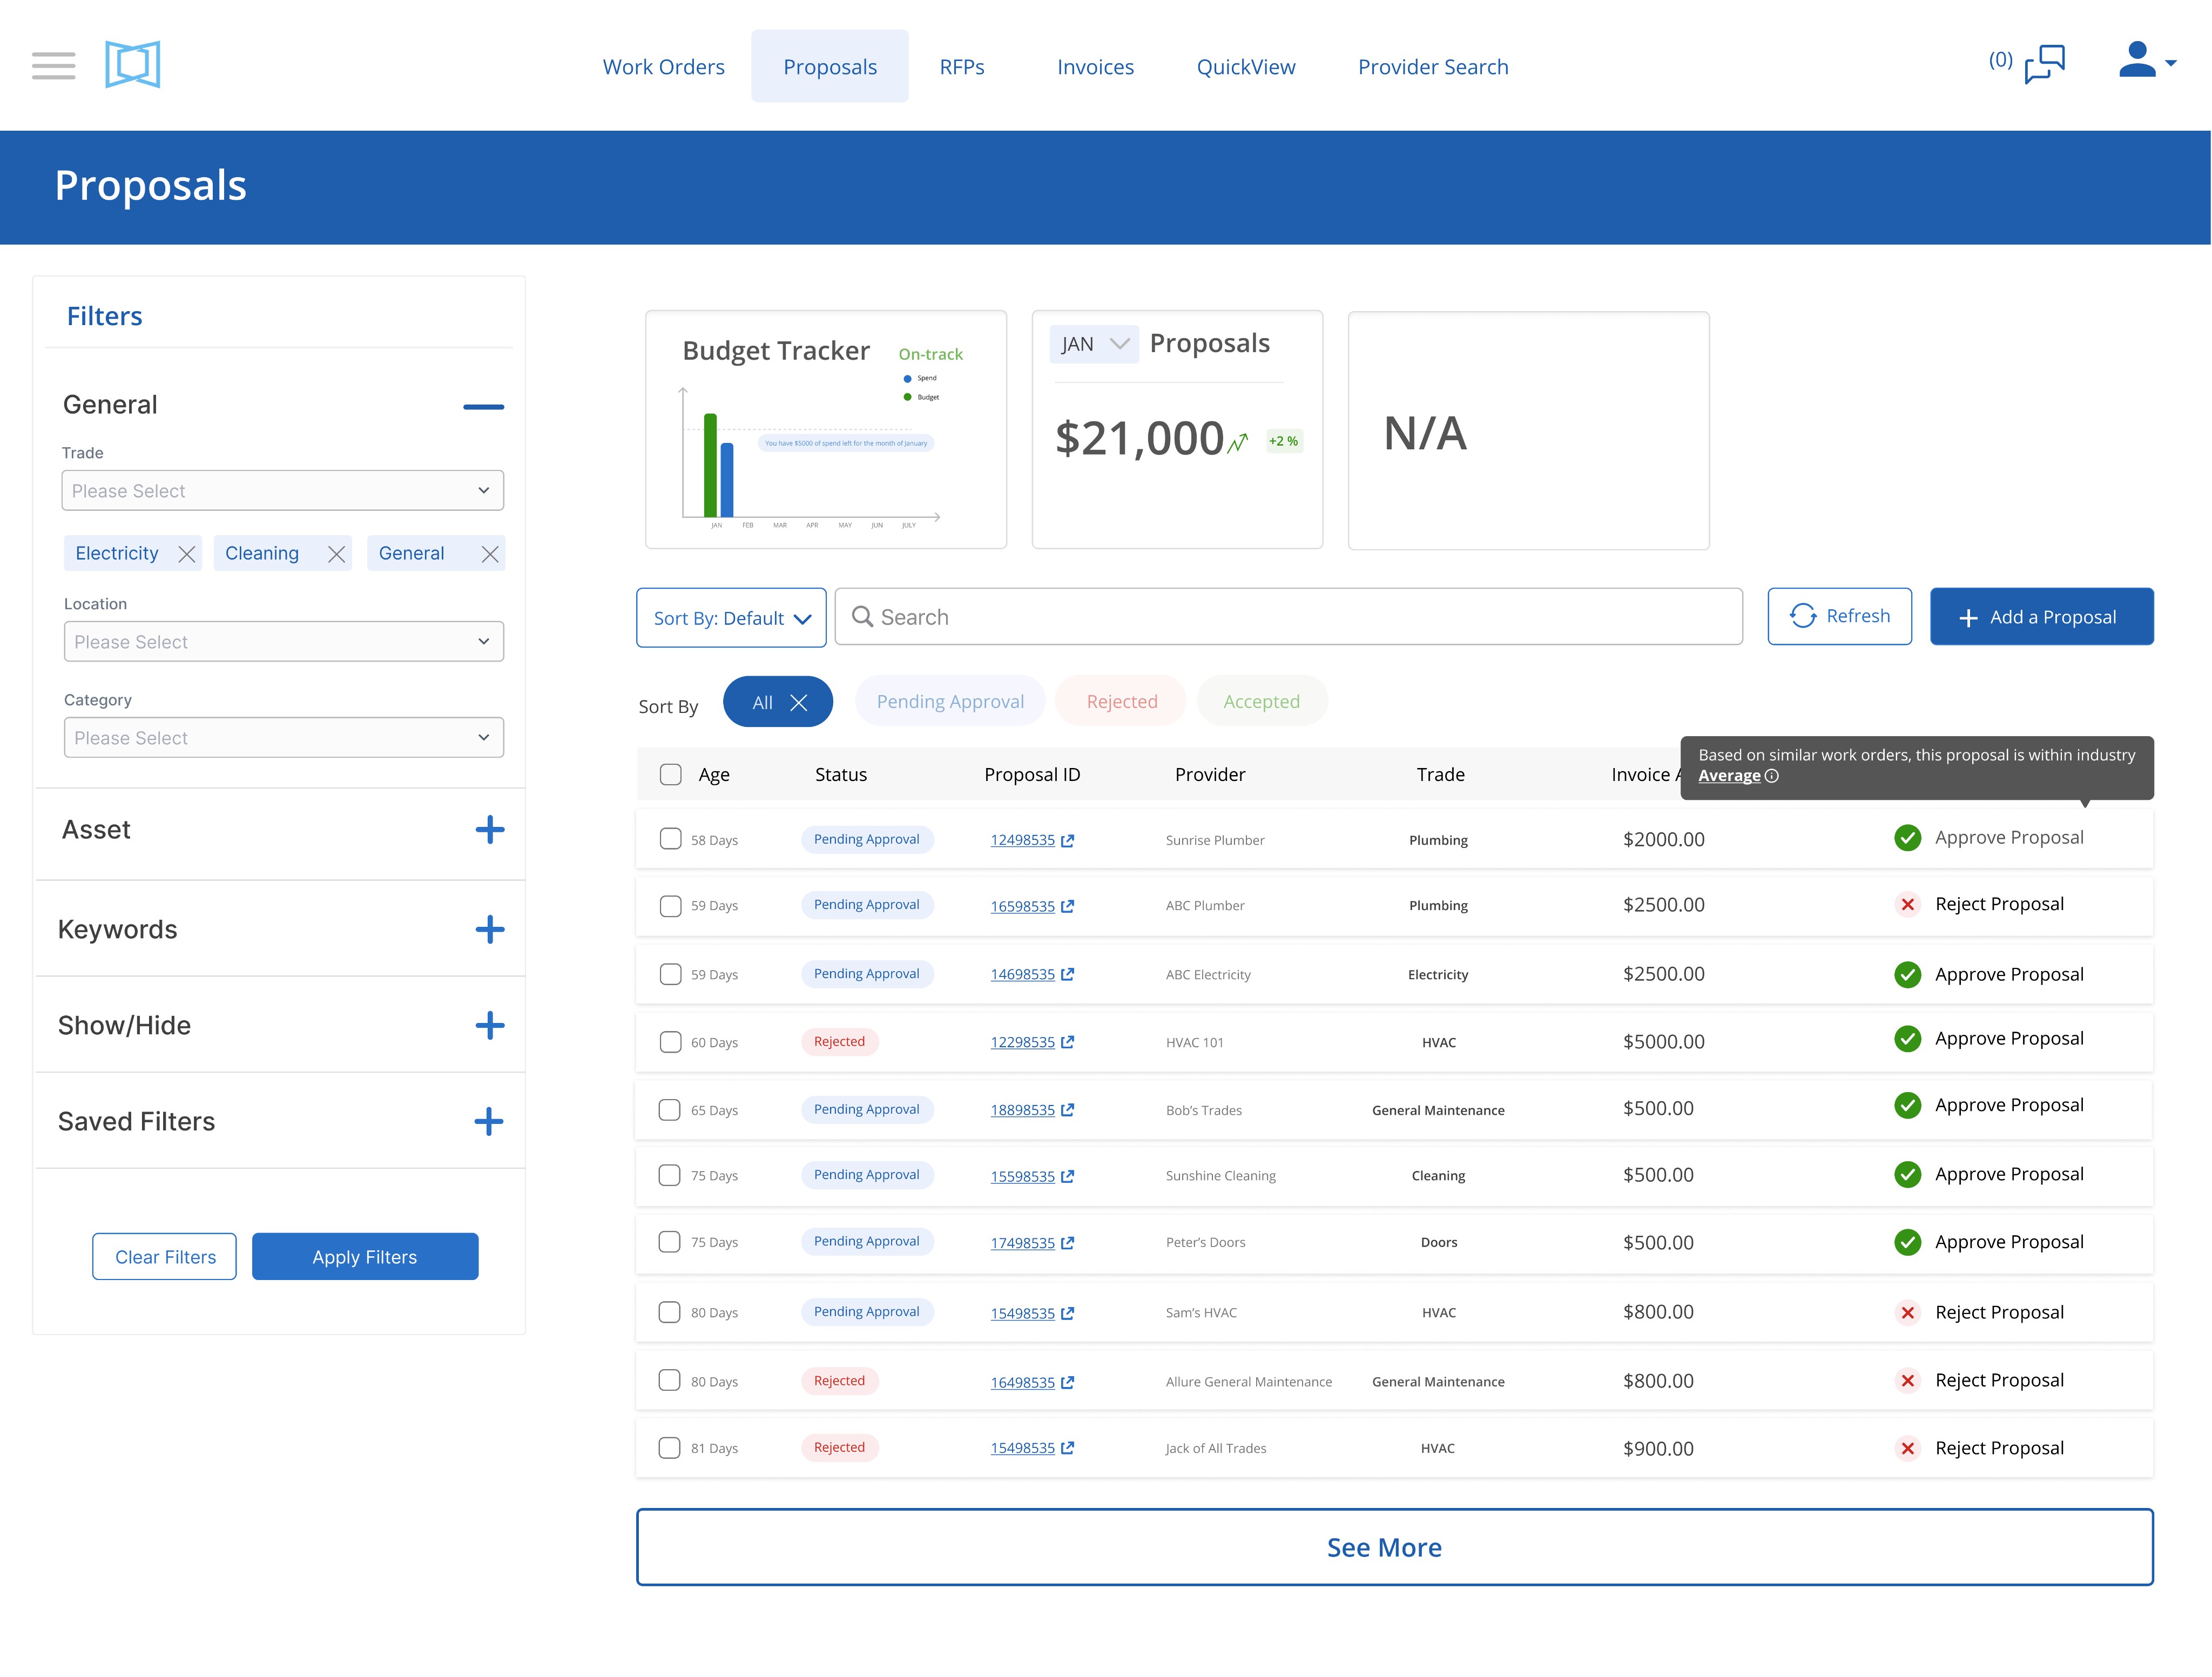
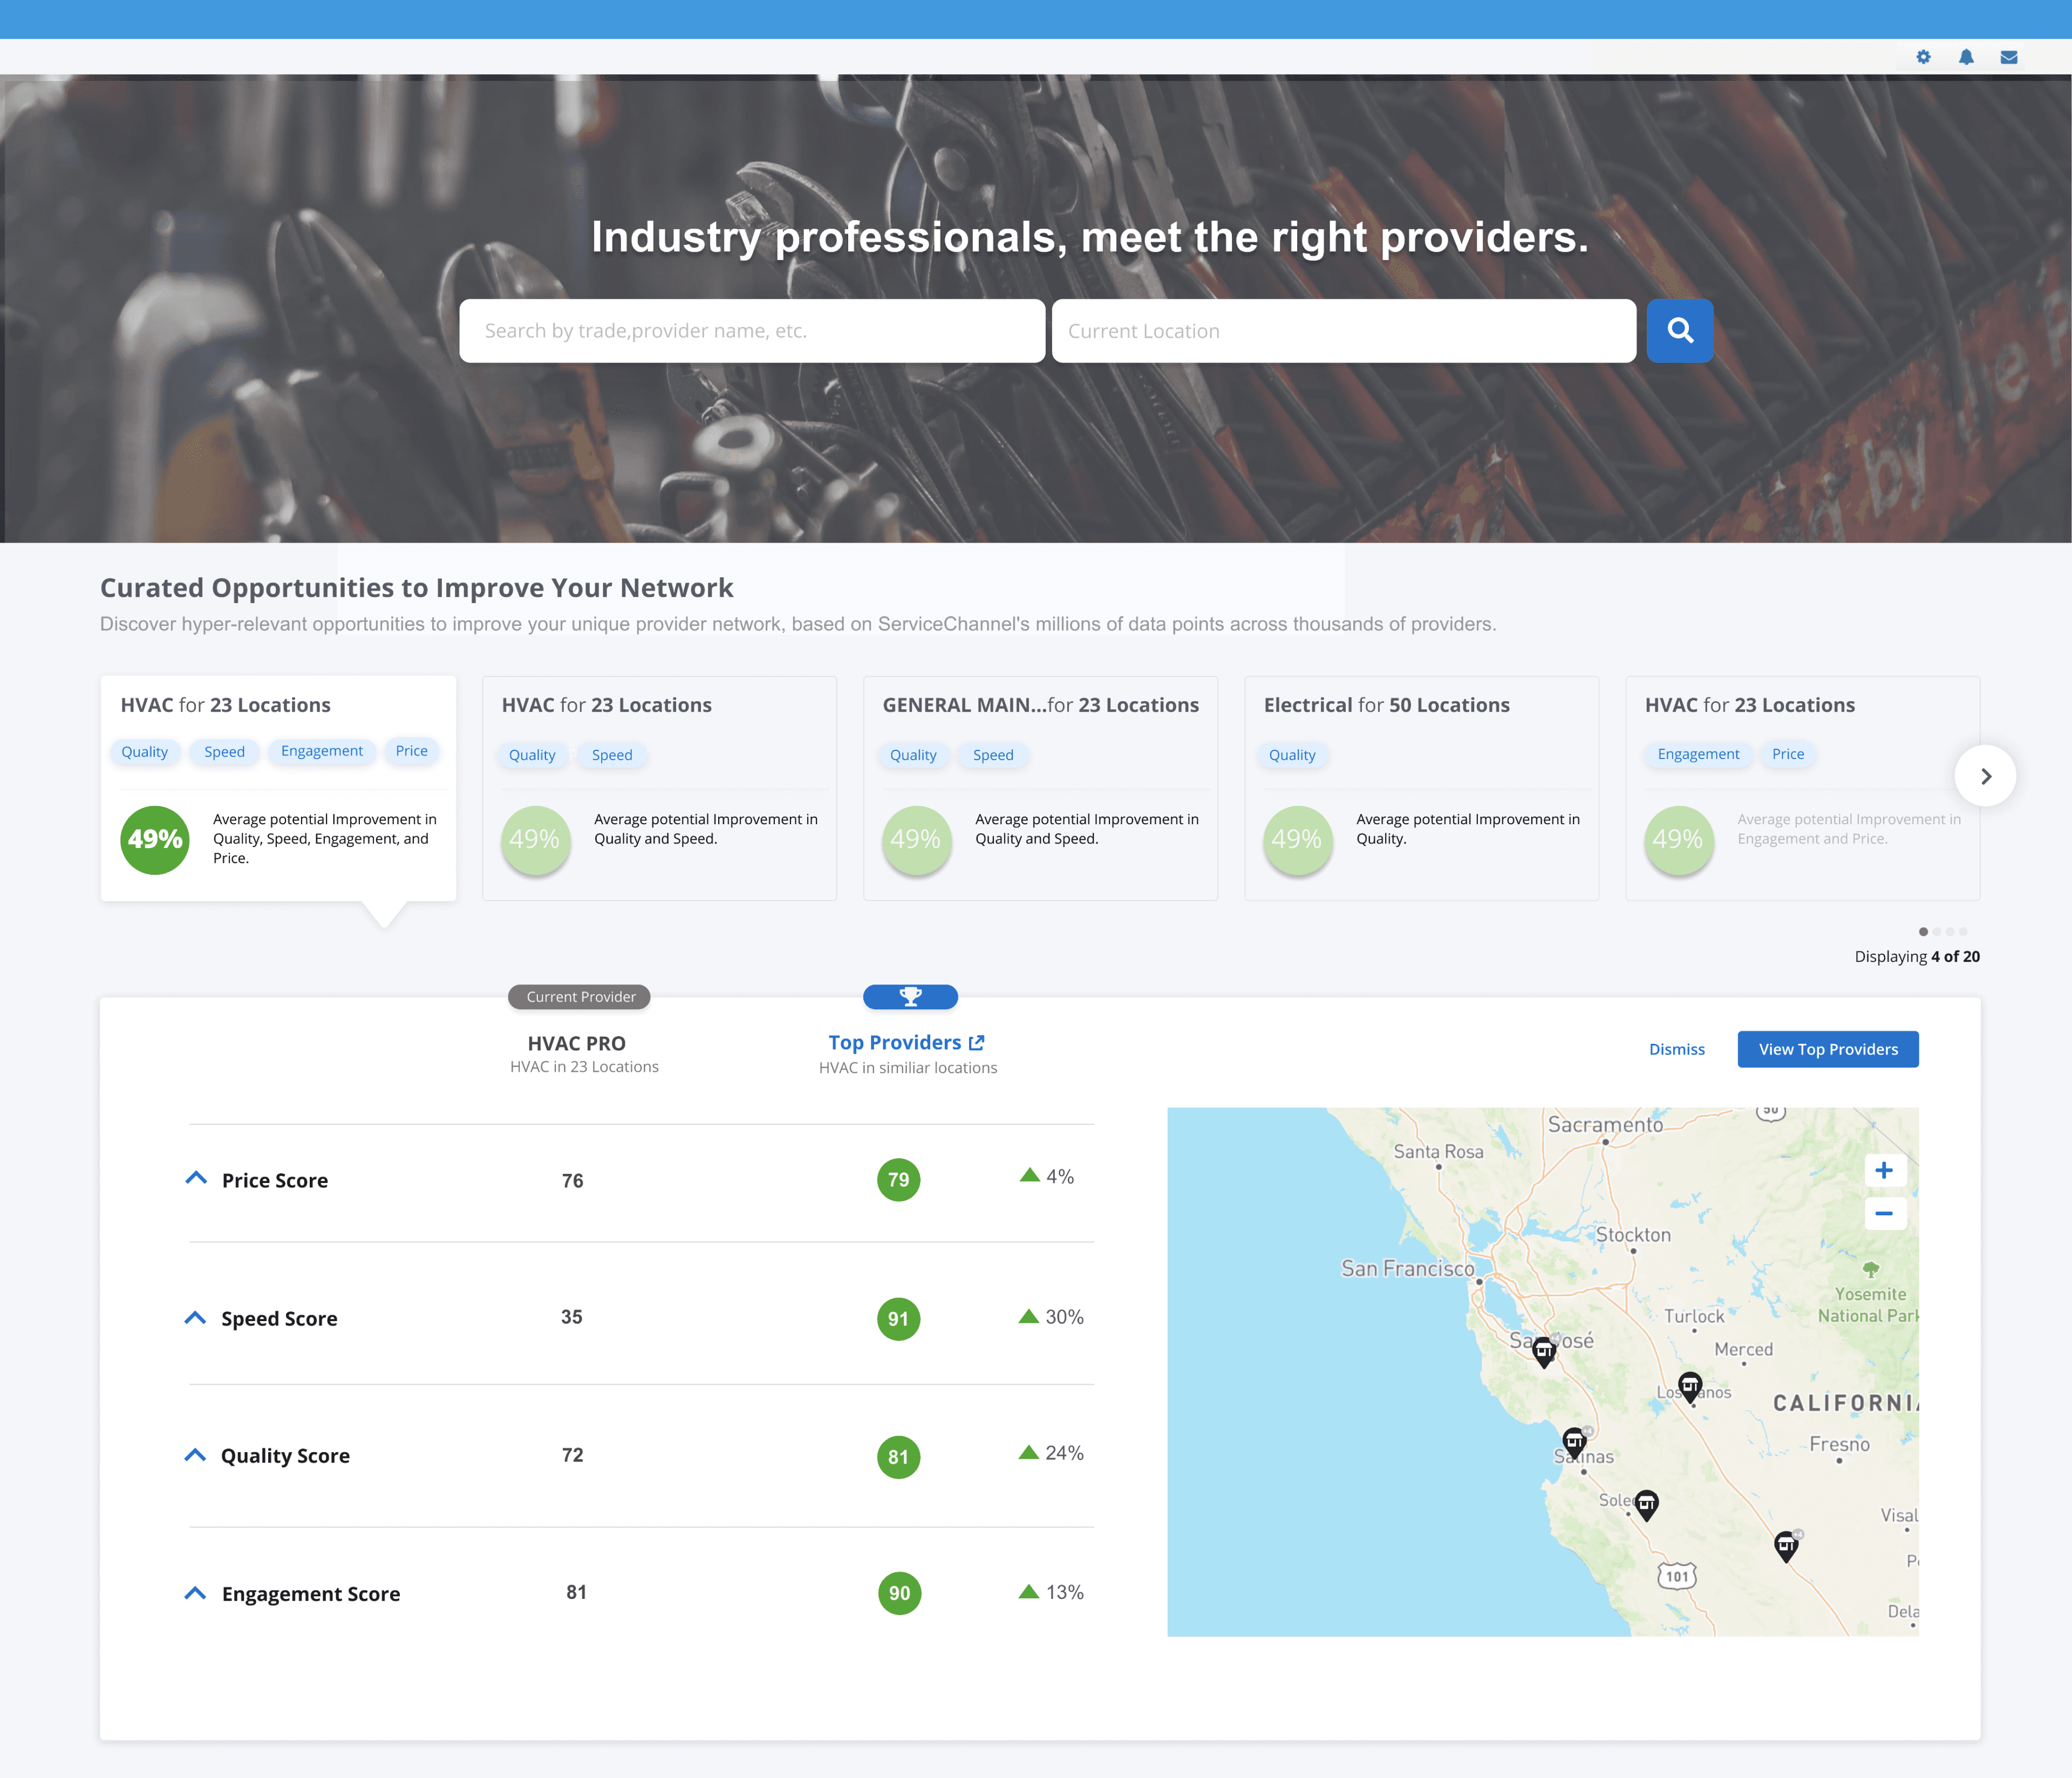
  • Proposal Recommender | Fit Score of 6.7 and Wow Score of 8

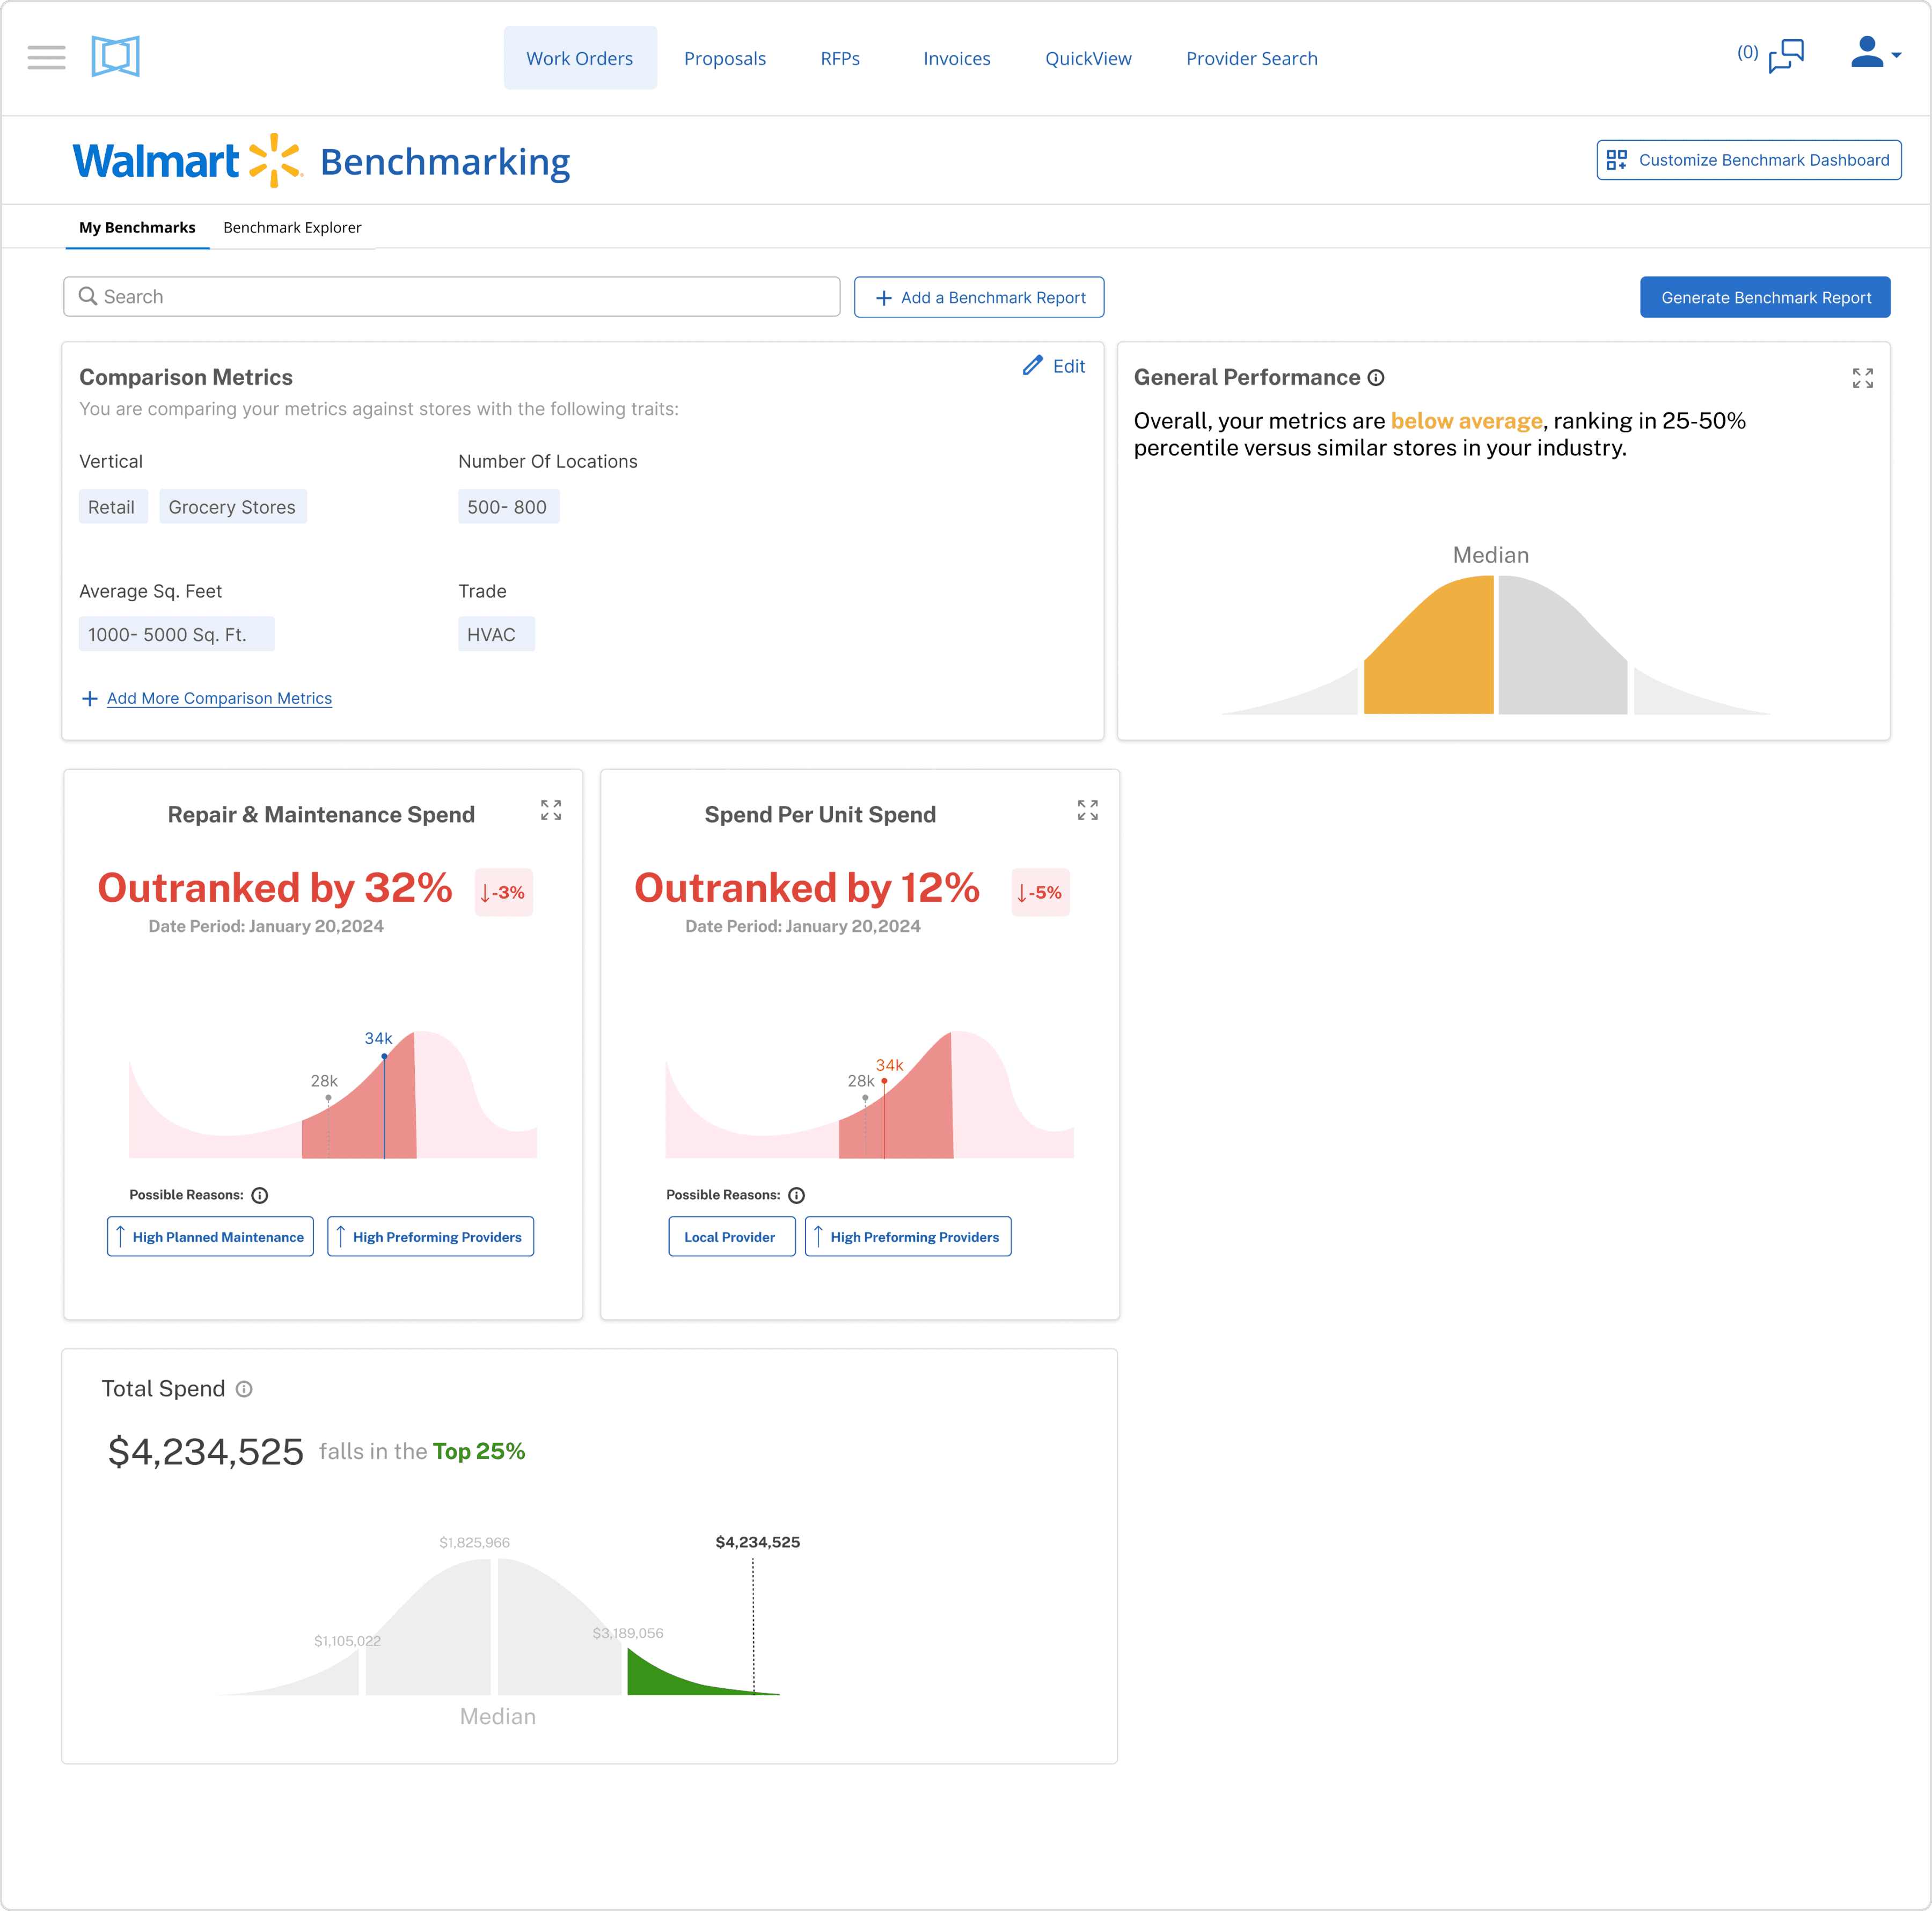
  • Spend Dashboard Benchmarking | Fit Score of 5 and Wow score of 10

  • Provider Module : Provider Network Evaluation | Fit Score of 8 and Wow Score of 7.5

Before & After Slider

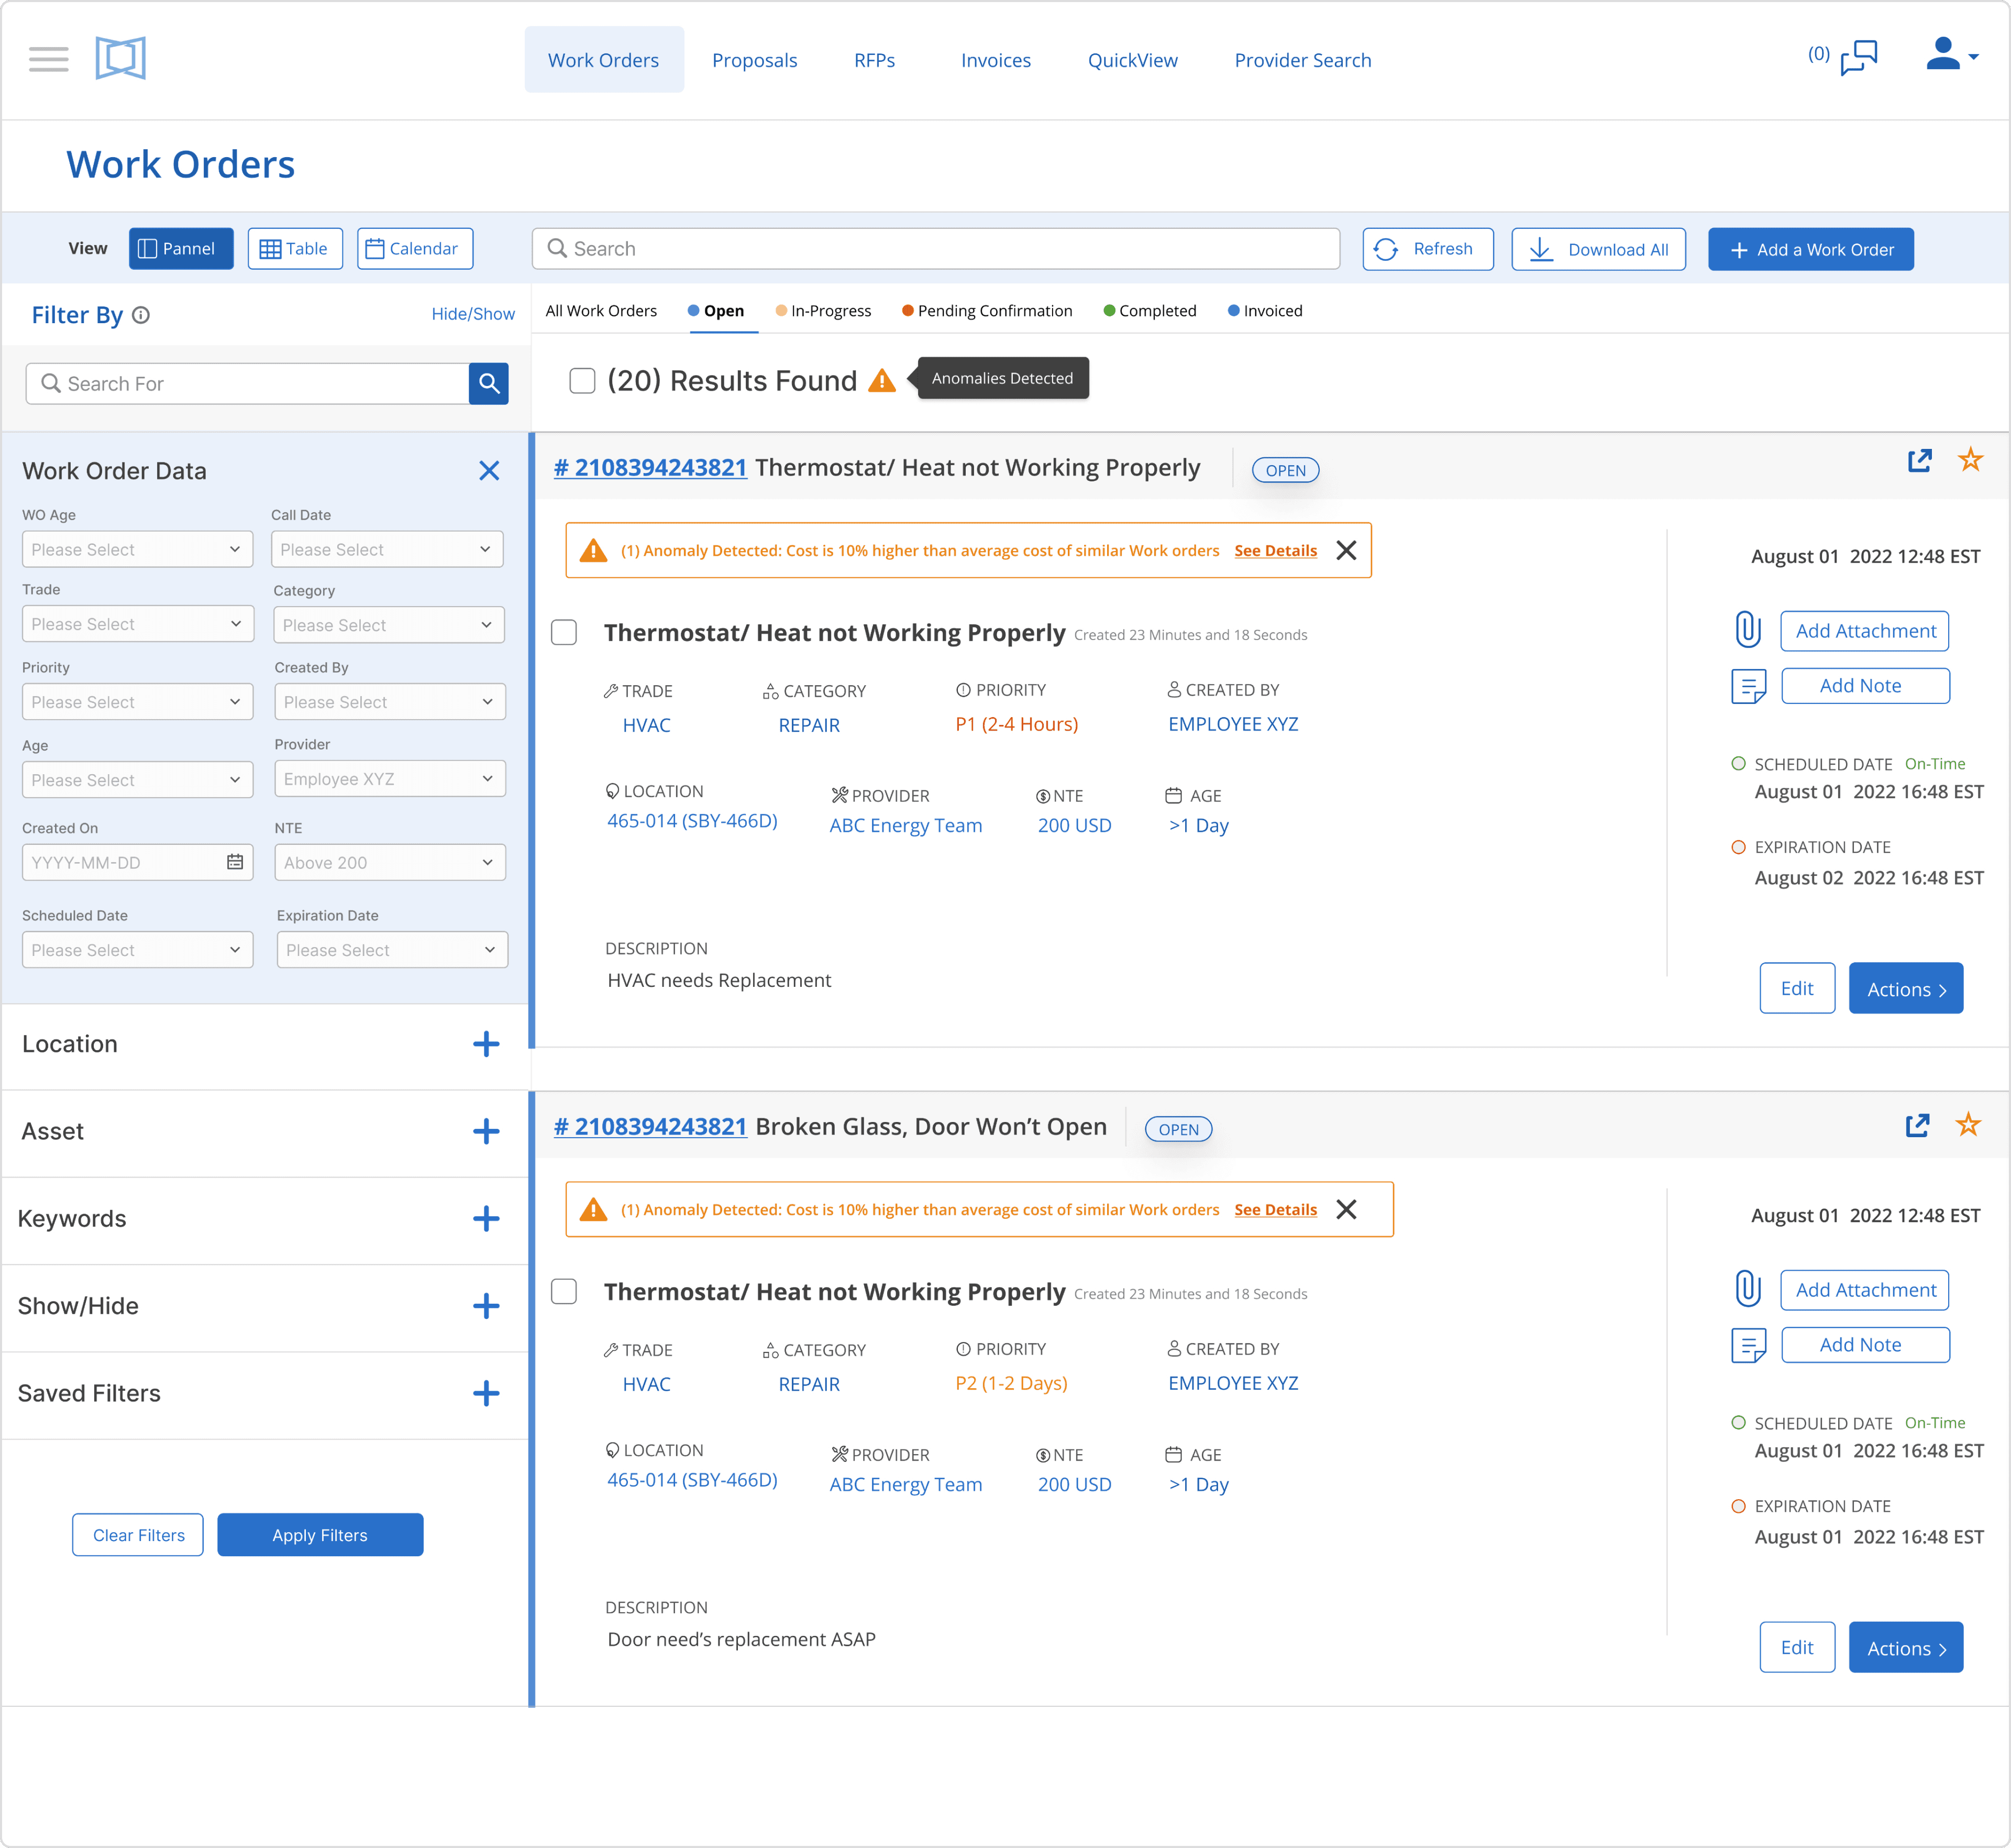
Before: The process was entirely manual, requiring users to closely monitor their work orders, create filters, and use different Excel sheets to detect anomalies. Additionally, the interaction relied on outdated, legacy systems, further complicating the user experience

After: Landing on the page, users are immediately presented with anomalies detected by the system's AI, eliminating the need for Facility Managers to manually monitor them. Additionally, the interface has been redesigned using the new design system, providing a more intuitive and streamlined user experience.

Impact?

Saving $480,729 in development costs, by prioritizing product feasibility study & cleaning data

As the Lead Growth Product Designer, I led the user experience strategy for the 'Work Order Anomaly Detection' project, driving impactful outcomes that included:

As the Lead Growth Product Designer, I led the user experience strategy for the 'Work Order Anomaly Detection' project, driving impactful outcomes that included:

  • Leading User Research: Conducted 15 Voice of Customer (VOC) sessions to identify key pain points, resulting in the creation of targeted solutions for both transactional and strategic Facility Managers.

  • Leading User Research: Conducted 15 Voice of Customer (VOC) sessions to identify key pain points, resulting in the creation of targeted solutions for both transactional and strategic Facility Managers.

  • Facilitating Innovation: : Led assumption mapping workshops to prioritize high-impact ideas, and developed low-fidelity prototypes that aligned with user needs and business goals.

  • Facilitating Innovation: : Led assumption mapping workshops to prioritize high-impact ideas, and developed low-fidelity prototypes that aligned with user needs and business goals.

  • Prototyping & Testing : Designed and validated the WO Anomaly Detection tool, and other rapid experimentation to understand which experimentation has a strong product market-fit.

  • Prototyping & Testing : Designed and validated the WO Anomaly Detection tool, and other rapid experimentation to understand which experimentation has a strong product market-fit.

  • Strategic Decision-Making : Recognized early challenges with data quality, leading to a strategic pivot that saved $480,729 in development costs, ensuring resources were focused on the most viable opportunities.